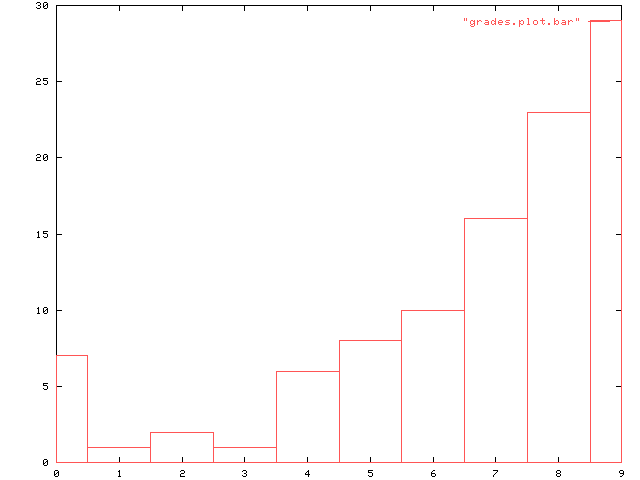
There are several handins that were similar or identical. For those of you who received a zero and believe that the similarity between your homework and the other person's was accidental, you should come talk to me.
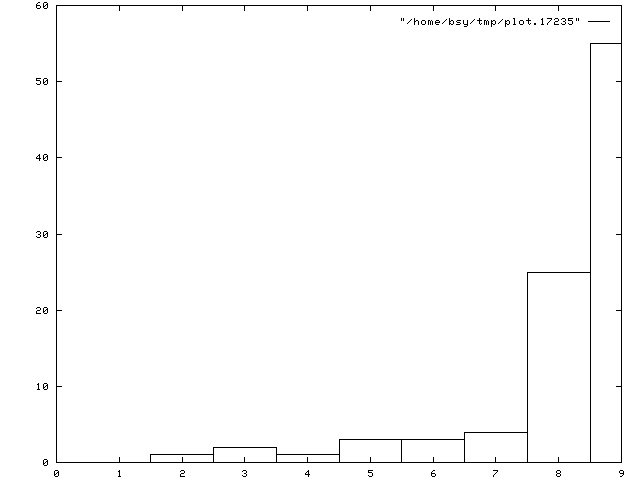
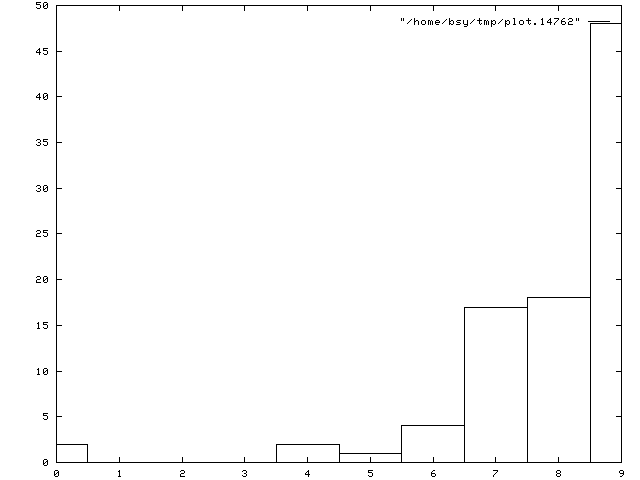
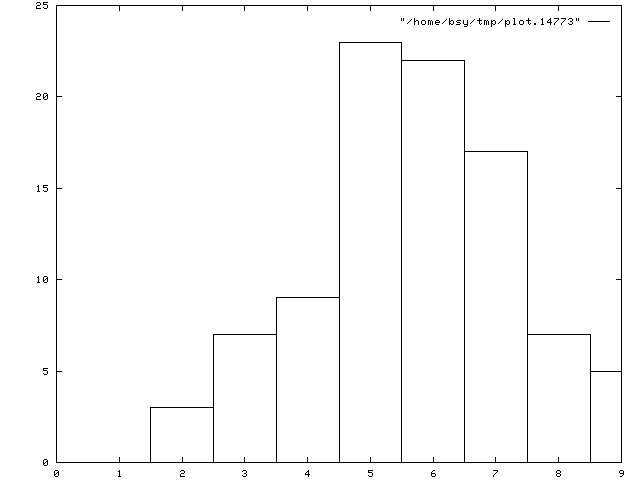
Midterm, with answers are available.
I did not expect you to finish it. The stats to the midterm is
available. The midterm grade distribution is:
If I were to assign a letter grade on the midterm (not really useful, since at the end of the quarter I will simply add the numeric scores together as weighed by the relative worth of homework/midterm/final), I would (roughly) give the people with more than 80 points an A, those with more than 60 points a B, those with more than 40 points a C, and the remainder a D.
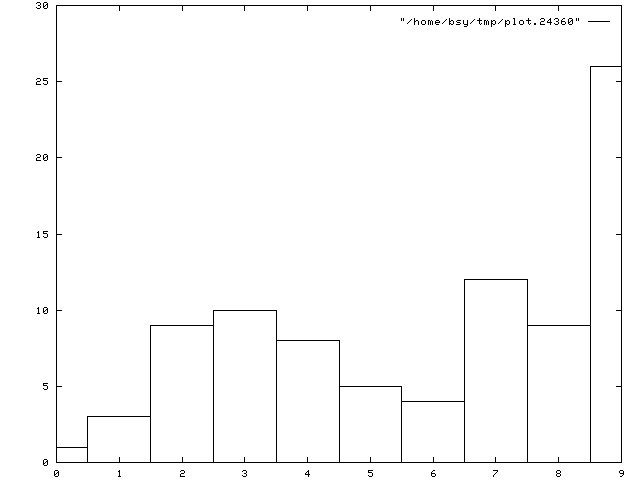
87 students handed in something.

Assignment as a whole: mean  63.5057
                       stdev 29.3535

Part  1:  mean  9.655172
          stdev 1.824656
Part  2:  mean  10.747126
          stdev 8.189169
Part  3:  mean  10.862069
          stdev 8.944493
Part  4:  mean  5.724138
          stdev 4.214615
Part  5:  mean  26.517241
          stdev 12.587041
Sample solutions to assignment 4 are available. There are three versions: A, B, and C.
A sample solution for assignment 5 is available. The comments are a little different that what I expect from you, since they are more pedagogical in nature -- pay attention to the stuff about the delay slots.
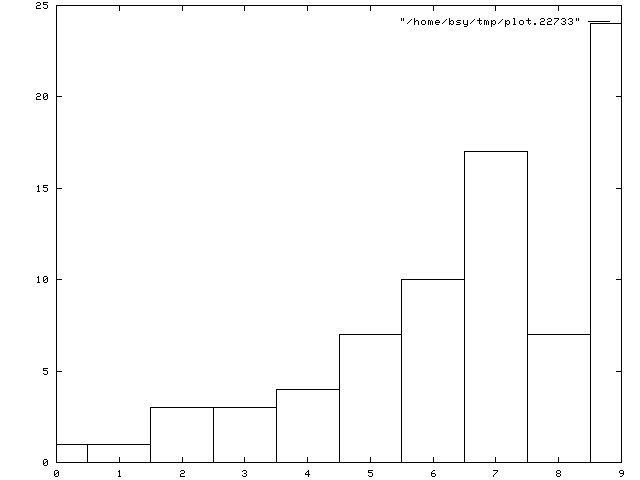
77 students handed in something.

Assignment as a whole: mean  70.3117
                       stdev 23.7324

Part  1:  mean  6.389610
          stdev 4.196956
Part  2:  mean  14.727273
          stdev 6.871050
Part  3:  mean  13.389610
          stdev 13.234308
Part  4:  mean  17.038961
          stdev 5.650978
Part  5:  mean  18.766234
          stdev 3.706422

bsy@cse.ucsd.edu, last updated